The 2% Inflation Target Was Improvised on Television in 1988
Disclosure: I am the founder of a company building settlement infrastructure on Bitcoin. Read the last section with that in mind.
Every major central bank on earth aims for 2 percent inflation. The Federal Reserve, the ECB, the Bank of England, the Bank of Japan, the Bank of Canada. The 2% inflation target is treated as a law of nature, the monetary equivalent of the speed of light. Jerome Powell has called it a global norm.
It is not a law of nature. It is the residue of an unscripted answer given on television in 1988 by a finance minister who had not told anyone he was going to say it.
Where the 2 percent inflation target came from
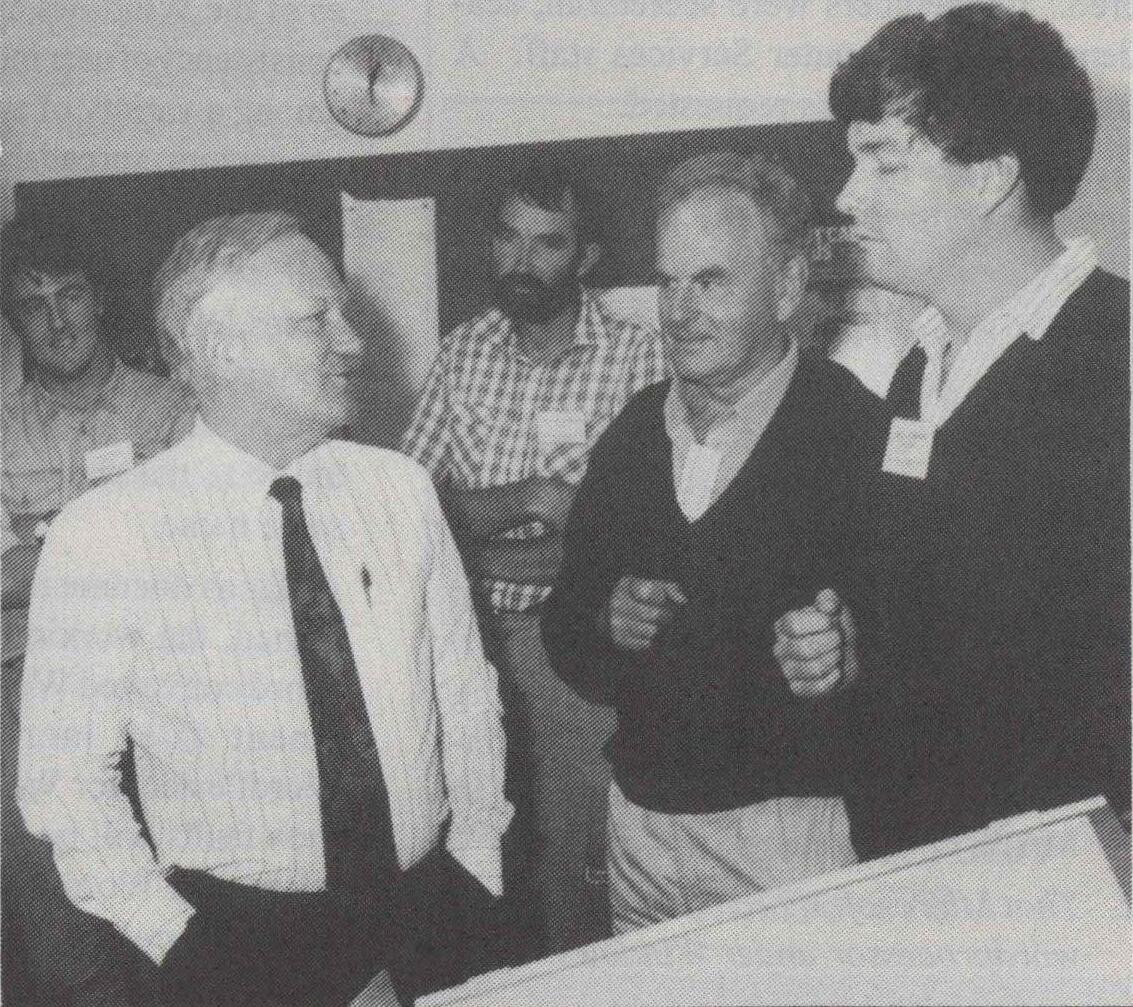
On 1 April 1988, New Zealand’s Minister of Finance Roger Douglas was on television talking about monetary policy. Inflation had just fallen into single digits for close to the first time in fifteen years, after peaking above 15 percent, and Douglas was worried the public would settle into expectations of 5 to 7 percent. So he said, on air, that policy would be directed at genuine price stability, “around 0, or 0 to 1 percent.” Murray Sherwin, then Deputy Governor of the Reserve Bank of New Zealand, recounted in a 1999 speech that Douglas made the announcement without consulting officials or, apparently, his parliamentary colleagues.[1] There was no target at the time and no framework requiring one. There was a minister answering a question.
Once the sentence existed, the institution had to catch up to it. The Reserve Bank took Douglas’s range and added a percentage point at the top to account for known measurement bias in the inflation data, producing 0 to 2 percent. Michael Reddell, who ran the Bank’s monetary policy unit, later described the number as having been settled on more by osmosis than by ministerial sign-off. Don Brash, who became Governor in September 1988 and was handed the job of delivering it, said the figure had been plucked out of the air.[2]
Then came the part that actually did the work. A number does not become credible because it is correct, it becomes credible because people with standing repeat it until repeating it back is the default. “0 to 2 by ‘92” became a mantra, delivered in hundreds of informal speeches to Rotary Clubs, chambers of commerce, farmers’ groups, church groups and schools. That was the explicit strategy and it worked, which is exactly why it should change how you read the target’s authority. It was manufactured by talking. It was not discovered. The Reserve Bank of New Zealand Act passed in December 1989 and took effect in February 1990, and Brash hit the band a year ahead of schedule.[3] The costs, usually left out of the retelling, were flat real GDP between 1989 and 1994 and double-digit unemployment.
Canada adopted a numerical target in 1991, the United Kingdom in 1992, then Sweden, then Australia. Note the sequence, because it runs backwards from how policy is supposed to work: the academic literature explaining how and why inflation targeting works accumulated after worldwide adoption, not before it. The theory arrived to explain a practice that was already winning. Paul Volcker, who had visited New Zealand in 1987 just after leaving the Fed, wrote later that he thought he knew where the target came from, and that it was not a matter of theory or of deep empirical studies but a practical decision made in a far-away place.[4]
The American chapter is on the record in a transcript. In July 1996 the FOMC sat down to work out what “price stability” meant. Janet Yellen, then a governor, pressed Alan Greenspan for a number. His answer: “I would say the number is zero, if inflation is properly measured.” Hers was 2 percent, imperfectly measured, drawing on work by Akerlof, Dickens and Perry published that same year: employers resist cutting nominal wages, so a little inflation lets real wages adjust downward without anyone signing a pay cut.[5] The committee converged on 2, and then Greenspan did not tell anyone. Don Kohn, running the monetary affairs division at the time, explained that Greenspan wanted to preserve the Fed’s discretion, which is hard to do once you have publicly committed to a number. The Fed operated with an unannounced 2 percent target for sixteen years, until Ben Bernanke made it official in January 2012, anchored to the PCE price index.[6]
So the chain runs: a minister improvises on television in 1988, a central bank reverse-engineers a band from the improvisation, the band goes global, and the world’s most important central bank privately adopts the number in 1996 and gets around to admitting it in 2012.
The evidence that was never there
Here is where it stops being a funny story about how institutions form and becomes something worth arguing about.
The entire structure rests on a premise: that falling prices are dangerous. That deflation is not merely inconvenient but self-reinforcing, that consumers postpone purchases waiting for lower prices, demand collapses, debts get heavier in real terms, and the economy spirals into the floor. This is why central banks target a positive number rather than zero. It is the reason given, over and over, for the whole apparatus.
The premise does not survive contact with the data.
Andrew Atkeson and Patrick Kehoe published a study in the American Economic Review in 2004 testing the deflation-depression link across 17 countries and more than a hundred years. Their finding: the only episode where the link shows up is the Great Depression. Everywhere else, essentially nothing. In their own summary, the historical record contains many more periods of deflation with reasonable growth than with depression, and many more periods of depression with inflation than with deflation.[7]
Claudio Borio and coauthors at the Bank for International Settlements ran a larger version of the test in 2015, covering 140 years and up to 38 economies. Same result. The link between goods and services deflation and output growth is weak, and what link exists derives largely from the 1930s. They found no evidence that high debt levels had so far made goods and services deflations more costly, which is the “debt deflation” mechanism specifically.[8]
What they did find is a strong link with asset price deflation, especially property, and that the most damaging combination is falling property prices interacting with private debt. Hold onto that, because it comes back.
This is not fringe work. It is the Minneapolis Fed and the BIS. The bar for anyone claiming deflation and depression are tightly linked was raised more than twenty years ago, and the claim has continued to circulate as though it were settled fact.
There is one dissent worth naming: Eichengreen and coauthors in 2016 found a more pronounced link when using wholesale prices rather than consumer prices.[9] It is a real result and it is about which index you look at, which turns out to be the theme of this entire piece.
The ruler stretches on purpose
If falling prices are not demonstrably dangerous, then a policy of permanent gentle inflation is not a defence against catastrophe. It is a decision to make the measuring unit shrink, forever, on purpose. That deserves to be looked at as a measurement question rather than a macroeconomic one.
Every mature science treats its units as sacred. Not because the numbers are magic, but because a unit that drifts corrupts every measurement expressed in it, including measurements taken decades apart by people who never met. The history of metrology is largely the history of hunting down drift and killing it.
Economics is the only “science” without a constant unit of measure. Real terms, deflators and chained indices exist precisely to correct for it, but that is an imprecise way to correct for imprecise measurements.

The kilogram is the clearest case. From 1889 until 2019, mass was defined by a platinum-iridium cylinder in a vault outside Paris, calibrated against six official copies stored under the same conditions. Over a century of comparisons, the prototype and its copies diverged by roughly 50 micrograms, about the weight of a grain of salt. Nobody could fully explain why. Surface contamination, adsorbed gases, cleaning residue.[10]
That drift was considered unacceptable. Not inconvenient, unacceptable, because the kilogram propagates into the newton, the joule and the pascal, so a wandering cylinder means every derived unit wanders with it. The response took decades of international effort and ended on 20 May 2019, when the kilogram was redefined in terms of the Planck constant and the last SI base unit stopped depending on a physical object.[11]
Hold the two numbers next to each other. The drift metrologists refused to tolerate was around 5 parts in 100 million, accumulated over a century. The drift central banks aim for is 2 parts in 100, every year, deliberately.
And it is deliberate. This is not a hidden agenda, it is the openly stated rationale: a slowly shrinking unit discourages holding cash and encourages spending and investing it. The measuring stick is designed to punish anyone who just wants to keep their savings in the thing that measures everything else.
Two consequences follow that are worth stating plainly.
The first is cognitive. Two percent is calibrated below the threshold of notice. Nobody watches their currency lose half its purchasing power over fifteen years, because it happens in increments smaller than ordinary price noise. You notice that rent is higher than it used to be. You do not experience it as the ruler shortening.
The second is that the drift is not evenly compensated. Wages, contracts and benefits are indexed imperfectly and with a lag. Capital gains tax is the sharpest example: in most jurisdictions you are taxed on nominal gains, so an asset that merely kept pace with inflation still produces a tax bill. You pay real tax on a gain that never existed. That is not a side effect of a drifting unit, it is what a drifting unit does when the tax code is written as though the unit were fixed.
The usual reply is that stability does not require zero drift, only predictable drift, and that a predictable 2 percent can be planned around. That is true for institutions with treasury desks and index-linked contracts. It is less true for a household holding cash, and it is not true at all for the capital gains example, where the drift is fully predictable and taxed anyway.
So why does it hold
If the stated justification is empirically thin, something else is doing the work.
Two things, mostly.
The first is the stock of debt. At 2 percent, the price level roughly doubles every fifteen years, which means the real value of every fixed nominal debt is cut in half over the same span. Public debt, mortgages, corporate leverage. Deflation runs that machine in reverse and makes creditors richer at debtors’ expense. Modern states and modern households are structurally short their own currency, and they have been for decades.
That is a legitimate policy consideration. Debt deflation can genuinely wreck a balance sheet even if it does not wreck GDP. But it is a distributional argument, about who gains and who loses, and it should be made in those terms. What actually happens is that it gets dressed up as a growth argument, which is the one the evidence does not support.
The second is the zero lower bound. Central banks want inflation high enough that nominal rates sit comfortably above zero, leaving room to cut in a downturn. This is true and also circular: you need room to cut rates because you have built a system whose response to every downturn is cutting rates. The justification for the target is the requirements of the tool, and the tool was chosen given the target.
Cantillon, or why the index is the whole argument
Richard Cantillon was an Irish-French banker who wrote Essai sur la Nature du Commerce en Général around 1730. It was published in French in 1755, twenty-one years after his death, then forgotten for a century until William Stanley Jevons rediscovered it in 1881 and called it the cradle of political economy.[12]
Cantillon is generally credited as the first person to show that changes in money and credit act on the economy by changing relative prices. His thought experiment: a country discovers a gold mine. The mine owners, their business associates and their preferred suppliers get the new money first and spend it at old prices. Everyone else gets it later and buys at prices that have already moved. The aggregate money supply statistic is the same for both groups. The outcome is not.[13]
The effect is named after him. It describes the real reallocation of resources that happens in the gap between money being created and the system fully adjusting.
The biographical detail is worth keeping rather than hiding. Cantillon made his fortune speculating in, and later helping fund, John Law’s Mississippi Company. He described the mechanism from the inside, as one of the people receiving the money first. That is the credibility of an insider, not a moralist.
Now put Cantillon next to Borio.
The 2 percent target governs one index: consumer prices. But the BIS finding is that the dangerous deflation is in asset prices, particularly property, in interaction with private debt. And Cantillon explains exactly why those are different things. New money does not spread evenly across the economy like heat through a metal bar. It enters at specific points, and those points are financial. It lifts the price of assets before it lifts the price of groceries, because the people holding it first buy assets.
Which gives you the decade after 2008. Central banks expanded balance sheets on an unprecedented scale, declared for years that they were undershooting their target because CPI would not reach 2 percent, and kept going. Meanwhile property and equities went vertical. The inflation was happening. It was happening where the thermometer was not pointed.
A doctrine born in a TV interview, justified by a mechanism the data does not support, applied to the wrong index.
What this means for Bitcoin
The Bitcoin issuance point is not a Cantillon window. It is tempting to say miners are the first receivers and leave it there, but that misses what makes the Cantillon effect a problem. The harm is not that money arrives in sequence. It is that a privileged group receives purchasing power it did not produce anything to obtain, and gets to spend it at pre-adjustment prices. Miners are in a different position. They buy hardware and electricity at market prices and compete against each other, and competition pushes returns toward marginal cost. Most of the subsidy is dissipated into real inputs rather than pocketed as rent. They are inside the circular flow, not standing at the tap ahead of it.
The structural difference is entry. Access to the fiat money-creation window is licensed: it runs through central bank counterparties, primary dealers and regulated banks, and you cannot buy your way in. Access to the Bitcoin subsidy runs through an open auction that anyone can enter by spending capital. The schedule is published in advance, identical for everyone, and declining toward zero.
This is not a claim of perfect flatness. Cheap stranded energy, chip allocation and manufacturers who mine with their own hardware all produce real asymmetries. But an asymmetry produced by competition is a different object from one produced by permission.
The constraint lives in enforced code. The 21 million ceiling and the halving schedule are not in the 2008 whitepaper. They live in the reference implementation and are enforced by every node that validates a block. That is precisely why they hold. The 2 percent target, by contrast, was never enforced on anyone. It was a convention agreed among officials, unannounced for sixteen years in the American case, and adjustable by press release. One constraint is a commitment. The other is an intention.
The standard objection to Bitcoin is the same premise this article has been dismantling. The objection: a fixed-supply money is deflationary, deflation is economically toxic, therefore Bitcoin cannot function as money. The middle term is the one that fails. It fails on Atkeson and Kehoe, and on Borio and the BIS, across a hundred and forty years of data from thirty-eight economies. Bitcoin does not need to win an argument about the future here. It needs people to stop treating a contested empirical claim as an axiom.
A related objection needs answering, because it gets raised constantly and it is usually raised wrong. Early holders did enormously better than late ones, and this gets called a Cantillon effect. It is not one. No money was created to hand them. Nobody was taxed to fund them. Later buyers transferred value voluntarily at prices they chose to accept, and early holders were compensated for having carried genuine total-loss risk on an asset that could plausibly have gone to nothing. Every monetizing asset in history has this shape. The distribution is unequal because the risk was unequal, not because access was gated.
The unequal returns and the volatility are the same fact seen from two angles. An asset in the process of being monetized has no reference price, so it discovers one violently, and the compensation for holding through that is the return. Volatility is the price of admission, paid in advance by whoever gets in early. As the market capitalizes and the flow of new supply keeps halving toward zero, both should compress together: less new issuance relative to the existing stock, deeper liquidity, smaller moves, smaller residual returns. The measured trend so far is consistent with that, though attributing it specifically to the halving schedule rather than to growing market depth is a plausible mechanism rather than a demonstrated one.
The concession that does survive is narrower and downstream. The 2020 to 2021 cycle ran on the same liquidity that inflated property and equities, and the people positioned to buy were the ones with access to it. Bitcoin did not create a Cantillon window, but it sat at the end of somebody else’s.
- Sherwin, M. (1999), “Inflation targeting: 10 years on”, speech to the New Zealand Association of Economists, 1 July 1999. Reserve Bank of New Zealand / BIS Review 79/1999.
- Brash, D. (2002), “Inflation targeting 14 years on”, Reserve Bank of New Zealand. Reddell’s account of how the 0 to 2 percent band was settled appears in Reserve Bank of New Zealand (2018), “Inflation Targeting in New Zealand: an experience in evolution”.
- Reserve Bank of New Zealand Act 1989, passed December 1989, in force February 1990. See also Reserve Bank of New Zealand (2018), “Inflation Targeting in New Zealand: an experience in evolution”.
- Volcker, P., on the origins of the New Zealand target. Adoption dates follow Hammond, G. (2012), “State of the art of inflation targeting”, Bank of England Centre for Central Banking Studies Handbook No. 29.
- FOMC transcript, meeting of 2 to 3 July 1996, Federal Reserve. Akerlof, G., Dickens, W. and Perry, G. (1996), “The Macroeconomics of Low Inflation”, Brookings Papers on Economic Activity 1996(1).
- Federal Open Market Committee (2012), “Statement on Longer-Run Goals and Monetary Policy Strategy”, 25 January 2012.
- Atkeson, A. and Kehoe, P. J. (2004), “Deflation and Depression: Is There an Empirical Link?”, American Economic Review 94(2), pp. 99-103. Also issued as Federal Reserve Bank of Minneapolis Staff Report 331 and NBER Working Paper 10268.
- Borio, C., Erdem, M., Filardo, A. and Hofmann, B. (2015), “The costs of deflations: a historical perspective”, BIS Quarterly Review, March 2015.
- Eichengreen, B. and coauthors (2016), on the deflation and output link measured with wholesale rather than consumer prices.
- Stock, G. et al. (2015), “Calibration campaign against the international prototype of the kilogram in anticipation of the redefinition of the kilogram, part I”, Metrologia 52(2).
- BIPM (2018), 26th General Conference on Weights and Measures, Resolution 1 on the revision of the SI, in force 20 May 2019. See also NIST, “Kilogram: The Present” and “Kilogram: Introduction”, SI Redefinition resources.
- Jevons, W. S. (1881), “Richard Cantillon and the Nationality of Political Economy”, Contemporary Review.
- Cantillon, R. (1755), Essai sur la Nature du Commerce en Général.